【Practical Exercise】Time-Frequency Analysis of Signals Using MATLAB
发布时间: 2024-09-14 06:45:47 阅读量: 70 订阅数: 85 

Time-Frequency Toolbox (TFTB) tutorial——[pudao整理书签版]
# 2.1 Principles and Methods of Time-Frequency Analysis
Time-frequency analysis is a technique that represents signals simultaneously in the time and frequency domains. It reveals the frequency components of a signal that change with time, providing a more comprehensive perspective for signal analysis and processing.
### 2.1.1 Short-Time Fourier Transform (STFT)
STFT is a classical method for time-frequency analysis. It divides the signal into a series of overlapping time windows and then performs a Fourier transform on each window. By connecting the spectra of each time window, the time-frequency distribution of the signal is obtained.
```matlab
% Signal
x = sin(2*pi*100*t) + sin(2*pi*200*t);
% STFT
[S, F, T] = spectrogram(x, 256, 128, 512, 1000);
% Plotting time-frequency distribution
surf(T, F, abs(S), 'EdgeColor', 'none');
xlabel('Time (s)');
ylabel('Frequency (Hz)');
zlabel('Magnitude');
```
# 2. MATLAB Time-Frequency Analysis Toolbox
### 2.1 Principles and Methods of Time-Frequency Analysis
Time-frequency analysis is a powerful technique in signal processing used to analyze the time-frequency characteristics of signals. It decomposes signals into a joint representation of time and frequency, thereby revealing hidden patterns and trends in the signal.
#### 2.1.1 Short-Time Fourier Transform (STFT)
STFT is one of the most commonly used methods in time-frequency analysis. It divides the signal into a series of overlapping windows and then applies a Fourier transform to each window. This results in a time-frequency diagram, where the time axis represents the window position, and the frequency axis represents the frequency components of the Fourier transform.
```matlab
% Import signal
x = load('signal.mat');
% Set STFT parameters
windowSize = 256;
overlap = 0.5;
% Calculate STFT
[S, F, T] = spectrogram(x, windowSize, overlap);
% Plot time-frequency diagram
imagesc(T, F, abs(S));
colorbar;
title('STFT Time-Frequency Diagram');
xlabel('Time');
ylabel('Frequency');
```
#### 2.1.2 Wavelet Transform
The wavelet transform is a multi-scale analysis technique that decomposes signals using a set of basis functions called wavelets. Wavelets have localization properties, which enable them to capture transient and non-stationary features of a signal.
```matlab
% Import signal
x = load('signal.mat');
% Set wavelet parameters
waveletName = 'db4';
scales = 1:10;
% Calculate wavelet transform
[C, L] = wavedec(x, scales, waveletName);
% Plot wavelet coefficient graph
figure;
for i = 1:length(scales)
subplot(length(scales), 1, i);
plot(C{i});
title(['Wavelet Coefficient Graph: Scale', num2str(scales(i))]);
end
```
#### 2.1.3 Hilbert-Huang Transform (HHT)
HHT is a nonlinear time-frequency analysis method that decomposes signals into a series of components called intrinsic mode functions (IMFs). IMFs are localized and represent different frequency components in the signal.
```matlab
% Import signal
x = load('signal.mat');
% Calculate HHT
imfs = emd(x);
% Plot HHT time-frequency diagram
figure;
for i = 1:length(imfs)
subplot(length(imfs), 1, i);
plot(x, imfs{i});
title(['Intrinsic Mode Function: ', num2str(i)]);
end
```
# 3. MATLAB Time-Frequency Analysis Practice
### 3.1 Time-Frequency Feature Extraction of Signals
#### 3.1.1 Power Spectral Density (PSD)
The power spectral density (PSD) is a function that describes how signal power is distributed across frequencies. It can reveal the spectral characteristics of a signal and is used to identify periodic components and noise in a signal.
**Calculation Method:**
```matlab
% Signal x
x = randn(1000, 1);
% Calculate PSD
psd = pwelch(x, [], [], [], 1024);
% Plot PSD
figure;
plot(psd);
xlabel('Frequency (Hz)');
ylabel('Power Spectral Density');
title('Power Spectral Density of Signal');
```
**Logical Analysis:**
* The `pwelch` function calculates the PSD of a signal, where:
* `x`: Input signal
* `[]`: Specifies the use of the default window size
* `[]`: Specifies the use of the default overlap rate
* `[]`: Specifies the use of the default sampling rate
* `1024`: Specifies the frequency resolution of the PSD
#### 3.1.2 Time-Frequency Distribution (TFD)
The time-frequency distribution (TFD) is a function that describes the energy distribution of a signal on the time-frequency plane. It can reveal the time-varying characteristics of a signal and is used for analyzing transient and non-stationary signals.
**Calculation Method:**
```matlab
% Signal x
x = chirp(0:0.001:10, 0, 1000, 2000);
% Calculate time-frequency distribution (using STFT)
tfd = spectrogram(x, 256, 128, 512, 1000);
% Plot time-frequency distribution
figure;
imagesc(tfd);
xlabel('Time (s)');
ylabel('Frequency (Hz)');
title('Time-Frequency Distribution of Signal');
```
**Logical Analysis:**
* The `spectrogram` function calculates the time-frequency distribution of a signal, where:
* `x`: Input signal
* `256`: Specifies the window size
* `128`: Specifies the overlap rate
* `512`: Specifies the frequency resolution
* `1000`: Specifies the sampling rate
#### 3.1.3 Coherence
Coherence is a function that describes the correlation between two signals. It can reveal the similarity and time-frequency relationship between signals.
**Calculation Method:**
```matlab
% Signals x and y
x = randn(1000, 1);
y = randn(1000, 1);
% Calculate coherence
coh = mscohere(x, y, [], [], [], 1000);
% Plot coherence
figure;
plot(coh);
xlabel('Frequency (Hz)');
ylabel('Coherence');
title('Coherence between Signals');
```
**Logical Analysis:**
* The `mscohere` function calculates the coherence of signals, where:
* `x`: Input signal 1
* `y`: Input signal 2
* `[]`: Specifies the use of the default window size
* `[]`: Specifies the use of the default overlap rate
* `[]`: Specifies the use of the default sampling rate
* `1000

 百万级
高质量VIP文章无限畅学
百万级
高质量VIP文章无限畅学
 千万级
优质资源任意下载
千万级
优质资源任意下载
 C知道
免费提问 ( 生成式Al产品 )
C知道
免费提问 ( 生成式Al产品 )
0
0
相关推荐

专栏目录
最低0.47元/天 解锁专栏
买1年送3月
百万级
高质量VIP文章无限畅学
千万级
优质资源任意下载
C知道
免费提问 ( 生成式Al产品 )
最新推荐
ARCGIS分幅图应用案例:探索行业内外的无限可能
# 摘要
ARCGIS分幅图作为地理信息系统(GIS)中的基础工具,对于空间数据的组织和管理起着至关重要的作用。本文首先探讨了ARCGIS分幅图的基本概念及其在地理信息系统中的重要性,然后深入分析了分幅图的理论基础、关键技术以及应用理论。文章详细阐述了分幅图的定义、类型、制作过程、地图投影、坐标系和数据格式转换等问题。在实践操作部分,本文详细介绍了如何使用ARCGIS软件制作分幅图,并
用户体验设计指南:外观与佩戴舒适度的平衡艺术
# 摘要
本论文全面探讨了用户体验设计的关键要素,从外观设计的理论基础和佩戴舒适度的实践方法,到外观与舒适度综合设计的案例研究,最终聚焦于用户体验设计的优化与创新。在外观设计部分,本文强调了视觉感知原理、美学趋势以及设计工具和技术的重要性。随后,论文深入分析了如何通过人体工程学和佩戴测试提升产品的舒适度,并且检验其持久性和耐久性。通过综合设计案例的剖析,论文揭示了设计过程中遇到的挑战与机遇,并展示了成功的
【install4j性能优化秘笈】:提升安装速度与效率的不传之秘

# 摘要
本文全面探讨了install4j安装程序的性能优化,从基础概念到高级技术,涵盖了安装过程的性能瓶颈、优化方法、实践技巧和未来趋势。分析了install4j在安装流程中可能遇到的性能问题,提出了启动速度、资源管理等方面的优化策略,并介绍了代码级与配置级优化技
MBI5253.pdf揭秘:技术细节的权威剖析与实践指南

# 摘要
本文系统地介绍了MBI5253.pdf的技术框架、核心组件以及优化与扩展技术。首先,概述了MBI5253.pdf的技术特点,随后深入解析了其硬件架构、软件架构以及数据管理机制。接着,文章详细探讨了性能调优、系统安全加固和故障诊断处理的实践方法。此外,本文还阐述了集成第三方服务、模块化扩展方案和用户自定义功能实现的策略。最后,通过分析实战应用案例,展示了MBI5253.pdf
【GP代码审查与质量提升】:GP Systems Scripting Language代码审查关键技巧
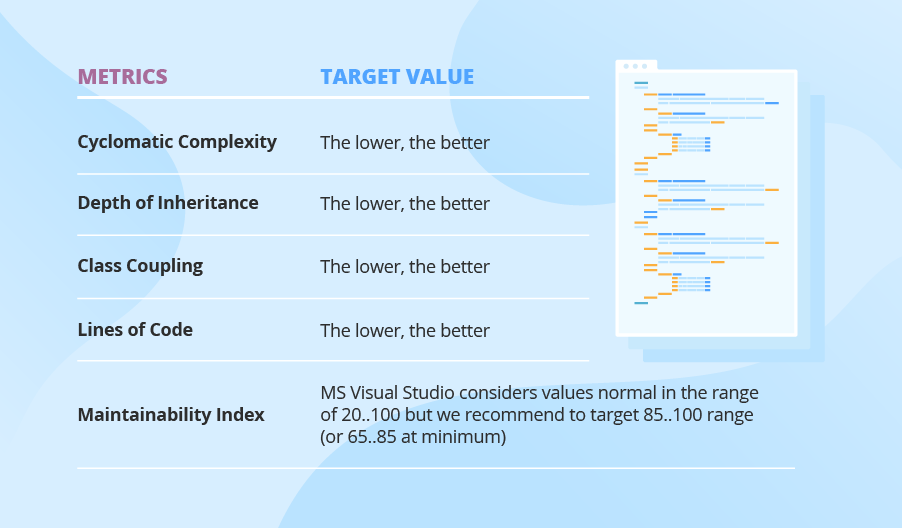
# 摘要
本文深入探讨了GP代码审查的基础知识、理论框架、实战技巧以及提升策略。通过强调GP代码审查的重要性,本文阐述了审查目标、常见误区,并提出了最佳实践。同时,分析了代码质量的度量标准,探讨了代码复杂度、可读性评估以及代码异味的处理方法。文章还介绍了静态分析工具的应用,动态
揭秘自动化控制系统:从入门到精通的9大实践技巧
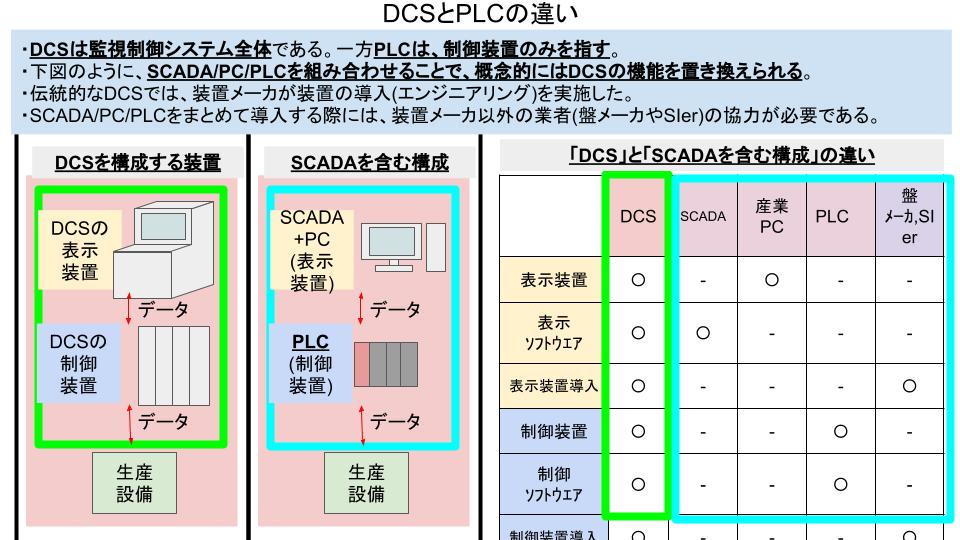
# 摘要
自动化控制系统作为现代工业和基础设施中的核心组成部分,对提高生产效率和确保系统稳定运行具有至关重要的作用。本文首先概述了自动化控制系统的构成,包括控制器、传感器、执行器以及接口设备,并介绍了控制理论中的基本概念如开环与闭环控制、系统的稳定性。接着,文章深入探讨了自动化控制算法,如PID控制、预测控制及模糊控制的原理和应用。在设计实践方面,本文详述了自动化控制系统
【环保与效率并重】:爱普生R230废墨清零,绿色维护的新视角
# 摘要
爱普生R230打印机是行业内的经典型号,本文旨在对其废墨清零过程的必要性、环保意义及其对打印效率的影响进行深入探讨。文章首先概述了爱普生R230打印机及其废墨清零的重要性,然后从环保角度分析了废墨清零的定义、目的以及对环境保护的贡献。接着,本文深入探讨了废墨清零的理论基础,提出了具体的实践方法,并分析了废墨清零对打印机效率的具体影响,包括性能提升和维护周期的优化。最后,本文通过实际应用案例展示了废墨清零在企业和家用环境中的应用效果,并对未来的绿色技术和可持续维护策略进行了展望。
# 关键字
爱普生R230;废墨清零;环保;打印机效率;维护周期;绿色技术
参考资源链接:[爱普生R2
【Twig与微服务的协同】:在微服务架构中发挥Twig的最大优势

# 摘要
本文首先介绍了Twig模板引擎和微服务架构的基础知识,探讨了微服务的关键组件及其在部署和监控中的应用。接着,本文深入探讨了Twig在微服务中的应用实践,包括服务端渲染的优势、数据共享机制和在服务编排中的应用。随后,文
【电源管理策略】:提高Quectel-CM模块的能效与续航

# 摘要
随着物联网和移动设备的广泛应用,电源管理策略的重要性日益凸显。本文首先概述了电源管理的基础知识,随后深入探讨了Quectel-CM模块的技术参数、电源管理接口及能效优化实践。通过理论与实践相结合的方法,本文分析了提高能效的策略,并探讨了延长设备续航时间的关键因素和技术方案。通过多个应用场景的案例研
STM32 CAN低功耗模式指南:省电设计与睡眠唤醒的策略
# 摘要
本文旨在全面探讨STM32微控制器在CAN通信中实现低功耗模式的设计与应用。首先,介绍了STM32的基础硬件知识,包括Cortex-M核心架构、时钟系统和电源管理,以及CAN总线技术的原理和优势。随后,详细阐述了低功耗模式的实现方法,包括系统与CAN模块的低功耗配置、睡眠与唤醒机制,以及低功耗模式下的诊断与
资源上传下载、课程学习等过程中有任何疑问或建议,欢迎提出宝贵意见哦~我们会及时处理!
点击此处反馈


专栏目录
最低0.47元/天 解锁专栏
买1年送3月
百万级
高质量VIP文章无限畅学
千万级
优质资源任意下载
C知道
免费提问 ( 生成式Al产品 )