【Advanced】MATLAB Statistical Analysis
发布时间: 2024-09-13 23:43:55 阅读量: 35 订阅数: 52 

Applied Multivariate Statistical Analysis
# 1. Introduction to MATLAB Statistical Analysis**
The MATLAB Statistics Toolbox provides a comprehensive collection of functions for performing a wide variety of statistical analyses, including descriptive statistics, inferential statistics, and regression analysis. These functions empower researchers and data analysts to process and analyze data with ease and efficiency, thereby uncovering valuable insights.
# 2. Statistical Data Analysis in MATLAB
### 2.1 Descriptive Statistical Analysis
#### 2***
***mon measures include:
- **Mean:** The sum of all data divided by the count of data points. The mean represents the typical value of the data.
- **Median:** The data value in the middle when the data is ordered from smallest to largest. The median is unaffected by extreme values.
- **Mode:** The most frequently occurring data. There may be multiple modes.
Functions in MATLAB to compute measures of central tendency:
```
% Calculating mean
mean_value = mean(data);
% Calculating median
median_value = median(data);
% Calculating mode
mode_value = mode(data);
```
#### 2.1.2 ***
***mon measures include:
- **Variance:** The sum of squared deviations from the mean, divided by the count of data points minus one. The larger the variance, the more spread out the data.
- **Standard Deviation:** The square root of the variance. Standard deviation represents the typical deviation from the mean.
- **Coefficient of Variation:** The ratio of the standard deviation to the mean. The coefficient of variation represents the relative spread of the data.
Functions in MATLAB to compute measures of dispersion:
```
% Calculating variance
variance_value = var(data);
% Calculating standard deviation
standard_deviation = std(data);
% Calculating coefficient of variation
coefficient_of_variation = std(data) / mean(data);
```
### 2.2 Inferential Statistical Analysis
#### 2.2.1 Hypothesis Testing
Hypothesis testing is a statistical method used to determine whether a given data set supports a particular hypothesis. The process includes:
1. Stating the null hypothesis (H0) and the alternative hypothesis (H1).
2. Determining the significance level (α).
3. Calculating the test statistic.
4. Making decisions based on the test statistic and the significance level.
Functions in MATLAB for performing hypothesis tests:
```
% T-test
[h, p, ci, stats] = ttest(data1, data2);
% One-way ANOVA
[p, table, stats] = anova1(data, groups);
% Chi-square test
[p, chi2, df] = chi2test(data);
```
#### 2.2.2 Confidence Intervals
A confidence interval is a statistical method used to estimate the true value of a parameter. It consists of a lower bound and an upper bound, and the probability that the true value lies within the confidence interval is high at a given confidence level.
Functions in MATLAB for calculating confidence intervals:
```
% Calculating confidence interval for mean
[lower_bound, upper_bound] = meanci(data, confidence_level);
% Calculating confidence interval for proportions
[lower_bound, upper_bound] = binofit(successes, trials, confidence_level);
```
# 3. Regression Analysis in MATLAB**
### 3.1 Linear Regression Models
#### 3.1.1 Model Fitting and Evaluation
Linear regression models are statistical models used for predicting continuous target variables. They assume a linear relationship between the target variable and the predictor variables. In MATLAB, the `fitlm` function is used to fit linear regression models.
```
% Data preparation
x = [1, 2, 3, 4, 5];
y = [2, 4, 6, 8, 10];
% Model fitting
model = fitlm(x, y);
% Model evaluation
disp('Model summary:');
disp(model);
```
The `fitlm` function returns a model object containing detailed information about the fitted model, including regression coefficients, R-squared values, and p-values.
#### 3.1.2 Model Prediction and Diagnostics
After fitting the model, predictions can be made for new data using the `predict` function.
```
% New data prediction
new_x = 6;
prediction = predict(model, new_x);
```
The `predict` function returns the predicted value and can be subjected to further analysis and visualization as needed.
To diagnose the goodness-of-fit of the model, residual analysis can be performed. Residuals are the differences between observed and predicted values.
```
% Residual analysis
residuals = model.Residuals.Raw;
plot(x, residuals, 'o');
xlabel('Independent variable');
ylabel('Residuals');
```
A residual plot can reveal trends and patterns in the model fit. If residuals are randomly scattered around 0, it indicates a good model fit.
### 3.2 Nonlinear Regression Models
#### 3.2.1 Model Selection and Fitting
Nonlinear regression models are use

 百万级
高质量VIP文章无限畅学
百万级
高质量VIP文章无限畅学
 千万级
优质资源任意下载
千万级
优质资源任意下载
 C知道
免费提问 ( 生成式Al产品 )
C知道
免费提问 ( 生成式Al产品 )
0
0
相关推荐

专栏目录
最低0.47元/天 解锁专栏
买1年送3月
百万级
高质量VIP文章无限畅学
千万级
优质资源任意下载
C知道
免费提问 ( 生成式Al产品 )
最新推荐
【VS2022升级全攻略】:全面破解.NET 4.0包依赖难题
# 摘要
本文对.NET 4.0包依赖问题进行了全面概述,并探讨了.NET框架升级的核心要素,包括框架的历史发展和包依赖问题的影响。文章详细分析了升级到VS2022的必要性,并提供了详细的升级步骤和注意事项。在升级后,本文着重讨论了VS2022中的包依赖管理新工具和方法,以及如何解决升级中遇到的问题,并对升级效果进行了评估。最后,本文展望了.NET框架的未来发
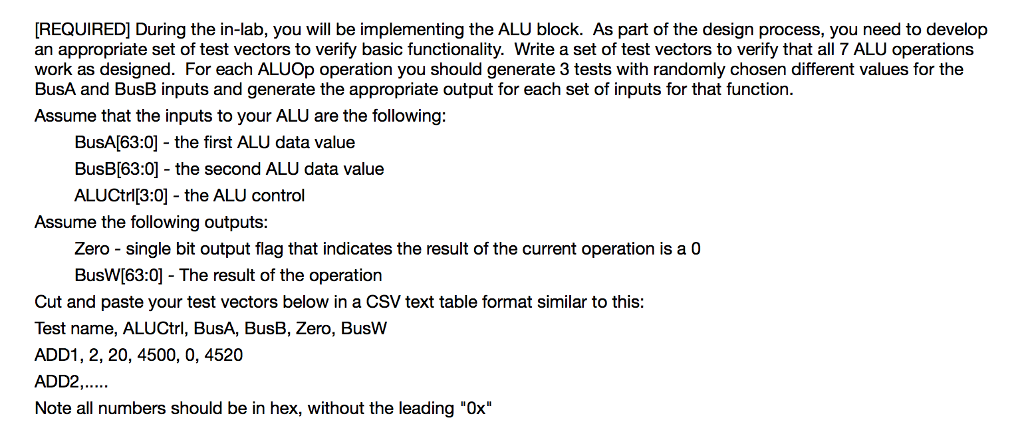
【ALU设计实战】:32位算术逻辑单元构建与优化技巧
# 摘要
算术逻辑单元(ALU)作为中央处理单元(CPU)的核心组成部分,在数字电路设计中起着至关重要的作用。本文首先概述了ALU的基本原理与功能,接着详细介绍32位ALU的设计基础,包括逻辑运算与算术运算单元的设计考量及其实现。文中还深入探讨了32位ALU的设计实践,如硬件描述语言(HDL)的实现、仿真验证、综合与优化等关
【网络效率提升实战】:TST性能优化实用指南

# 摘要
本文全面综述了TST性能优化的理论与实践,首先介绍了性能优化的重要性及基础理论,随后深入探讨了TST技术的工作原理和核心性能影响因素,包括数据传输速率、网络延迟、带宽限制和数据包处理流程。接着,文章重点讲解了TST性能优化的实际技巧,如流量管理、编码与压缩技术应用,以及TST配置与调优指南。通过案例分析,本文展示了TST在企业级网络效率优化中的实际应用和性能提升措施,并针对实战
【智能电网中的秘密武器】:揭秘输电线路模型的高级应用

# 摘要
本文详细介绍了智能电网中输电线路模型的重要性和基础理论,以及如何通过高级计算和实战演练来提升输电线路的性能和可靠性。文章首先概述了智能电网的基本概念,并强调了输电线路模型的重要性。接着,深入探讨了输电线路的物理构成、电气特性、数学表达和模拟仿真技术。文章进一步阐述了稳态和动态分析的计算方法,以及优化算法在输电线路模型中的应用。在实际应用方面,本文分析了实时监控、预测模型构建和维护管理策略。此外,探讨了当前技术面临的挑战和未来发展趋势,包括人
【扩展开发实战】:无名杀Windows版素材压缩包分析
# 摘要
本论文对无名杀Windows版素材压缩包进行了全面的概述和分析,涵盖了素材压缩包的结构、格式、数据提取技术、资源管理优化、安全性版权问题以及拓展开发与应用实例。研究指出,素材压缩包是游戏运行不可或缺的组件,其结构和格式的合理性直接影响到游戏性能和用户体验。文中详细分析了压缩算法的类型、标准规范以及文件编码的兼容性。此外,本文还探讨了高效的数据提取技
【软件测试终极指南】:10个上机练习题揭秘测试技术精髓
# 摘要
软件测试作为确保软件质量和性能的重要环节,在现代软件工程中占有核心地位。本文旨在探讨软件测试的基础知识、不同类型和方法论,以及测试用例的设计、执行和管理策略。文章从静态测试、动态测试、黑盒测试、白盒测试、自动化测试和手动测试等多个维度深入分析,强调了测试用例设计原则和测试数据准备的重要性。同时,本文也关注了软件测试的高级技术,如性能测试、安全测试以及移动
【NModbus库快速入门】:掌握基础通信与数据交换
# 摘要
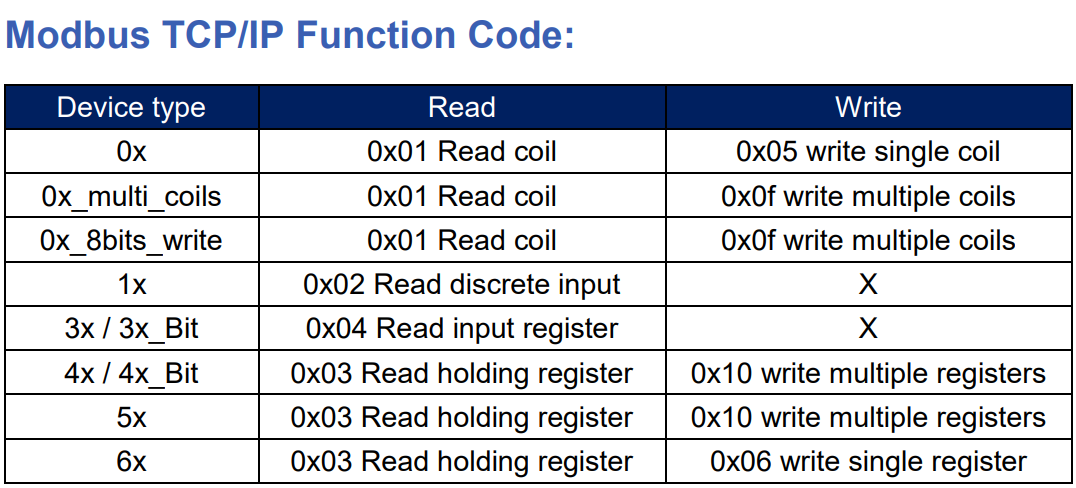
本文全面介绍了NModbus库的特性和应用,旨在为开发者提供一个功能强大且易于使用的Modbus通信解决方案。首先,概述了NModbus库的基本概念及安装配置方法,接着详细解释了Modbus协议的基础知识以及如何利用NModbus库进行基础的读写操作。文章还深入探讨了在多设备环境中的通信管理,特殊数据类型处理以及如何定
单片机C51深度解读:10个案例深入理解程序设计
# 摘要
本文系统地介绍了基于C51单片机的编程及外围设备控制技术。首先概述了C51单片机的基础知识,然后详细阐述了C51编程的基础理论,包括语言基础、高级编程特性和内存管理。随后,文章深入探讨了单片机硬件接口操作,涵盖输入/输出端口编程、定时器/计数器编程和中断系统设计。在单片机外围设备控制方面,本文讲解了串行通信、ADC/DAC接口控制及显示设备与键盘接口的实现。最后,通过综合案例分
资源上传下载、课程学习等过程中有任何疑问或建议,欢迎提出宝贵意见哦~我们会及时处理!
点击此处反馈


专栏目录
最低0.47元/天 解锁专栏
买1年送3月
百万级
高质量VIP文章无限畅学
千万级
优质资源任意下载
C知道
免费提问 ( 生成式Al产品 )